-
Investment

Start SIP Invest Monthly

SIF Investment Build wealth with Specialised Funds

Freedom SIP Plan Your Future with Freedom SIP

Start Lumpsum Invest One Time

Index Fund Readymade Index Portfolios

International Fund Buy Foreign Companies

New Fund Offer Invest in Newly Launched Funds

Gold Fund Buy 24k Digital Gold


- Explore
-
NEW
Tools

SIP Calculator Calculate Future value of SIP Investment

SWP Calculator Plan Your Wealth with Our SWP Calculator

Step-Up SIP Calculator Step Up Your SIP Strategy with Our Calculator

STP Calculator Calculate Your STP Returns Easily

MF Portfolio OverlapCheck Common Stocks Before You Invest

Compare Funds Detailed comparison of funds in

MF Screener Pinpoint the right funds
NEW
Client Assessment Know your investment personality
All Calculator All Financial Calculators at your Fingertips
-
Blogs

Mutual Fund Research Reports Detail Analysis of Mutual Fund

MF Expert Views Views by Expert on News

Mutual Fund News Find Latest News & Updates

Mutual Fund Learning Learn Concept of Mutual Funds

Newsletter Read market update month wise

Web Story Quick informative & trending stories

Blogs Explore trends, tips & strategies
-
Pro Services


Expert Curated Portfolios Smart portfolios crafted by market specialists

Funds Recommendations Get best funds shortlisted by expert for 2026

Portfolio Check-up Fix your portfolio with top MF Analyst

Personalised SIP Portfolio Get portfolio customised according to your needs

Loan Against Mutual Funds Get instant cash against securities

Large Cap Mutual Funds
Find here some best Large Cap fund to invest
- Annual Returns 13.45%
- Average Risk Medium
- Total Funds 36
What is Large Cap Mutual Fund?
As the name suggests, large cap mutual funds invest mainly in large companies that are among the top 100 by market value. These companies are well-established and stable, making these funds safer compared to mid or small-cap funds. SEBI requires that at least 80% of the fund's investment go into these large companies.
Some well-known large cap companies include Reliance, TCS and Nestle. These funds are good for long-term investments because of their stability. If you are looking for safe and reliable growth, large cap mutual funds could be a good option for you.
- The average returns of good large cap mutual funds range between 12-15% per annum.
- The top performing large cap mutual funds have moderate risk, giving more stable returns vs small caps.
- The best recommended time for minimum investment is 5+ years.
 5 Best Funds to Invest in India!


Top 5 Large Cap Funds for 2-3X Returns in 5 Yrs
Latest Recommendation By Team of ExpertsTop Performing Large Cap Funds in India for High Returns
Returns
SIP Returns
Risk
Information
NAV Details
Data in this table : Get historical returns. If 1Y column is 10% that means, fund has given 10% returns in last 1 year.
Select date points :
Submit| Fund Name | AUM (Cr.) | Fund Age | 1W | 1M | 3M | 6M | YTD | 1Y | 2Y | 3Y | 5Y | 10Y | |
|---|---|---|---|---|---|---|---|---|---|---|---|---|---|

NIFTY 100 |
-0.26% | 1.65% | 6.71% | -6.13% | -6.04% | -2.17% | 0.64% | 10.45% | 9.28% | 11.83% | |||
| 3281.16 | 3 years | -0.04% | 2.68% | 15.05% | 3.23% | 2.5% | 4.75% | 1.8% | 15.44% | - | - | Invest | |
| 213.25 | - | -0.54% | 1.53% | 7.78% | -0.12% | -0.42% | 4.13% | 1.13% | 14.35% | - | - | Invest | |
| 53527.40 | 20 years | 0.39% | 2.35% | 7.89% | -1.78% | -2.28% | 1.97% | 4.05% | 11.49% | 11.21% | 12.33% | Invest | |
| 1748.94 | 16 years | 0.23% | 2.95% | 10.31% | -0.87% | -0.34% | 0.91% | 4.17% | 14.6% | 12.61% | 12.88% | Invest | |
| 2681.70 | 28 years | -0.05% | 1.02% | 6.96% | -3.65% | -4.36% | 0.35% | 1.67% | 12.2% | 11.02% | 11.98% | Invest | |
| 2000.94 | 20 years | -0.17% | 1.07% | 5.94% | -4.21% | -4.51% | 0.15% | 2.95% | 13.51% | 11.46% | 12.68% | Invest | |
| 17.07 | 1 months | -0.16% | 1.03% | - | - | - | - | - | - | - | - | Invest | |
| 739.03 | 4 months | -0.32% | 0.65% | 5.28% | - | - | - | - | - | - | - | Invest | |
| 1758.08 | 23 years | 0.26% | 2.2% | 4.33% | -4.62% | -5.08% | -0.11% | 1.7% | 11.88% | 10.03% | 12.25% | Invest | |
| 50.56 | 9 months | -0.24% | 0.78% | 5.57% | -4.32% | -3.55% | -0.19% | 1.13% | 13.02% | 10.29% | 10.13% | Invest | |
| 128.83 | 14 years | -0.14% | 1.59% | 5.63% | -3.43% | -3.78% | -0.26% | 0.31% | 11.79% | 10.04% | 11.15% | Invest | |
| 1471.25 | 1 years | -0.03% | 2.05% | 5.82% | -4.49% | -4.99% | -0.53% | - | - | - | - | Invest | |
| 51660.30 | 18 years | 0.19% | 1.32% | 5.62% | -4.33% | -4.35% | -0.86% | 2.67% | 14.52% | 15.1% | 14.62% | Invest | |
| 1170.63 | 3 years | 0.19% | 2.07% | 7.22% | -4.97% | -5.07% | -1.04% | 3.29% | 13.59% | - | - | Invest | |
| 37692.41 | 18 years | 0.08% | 1.61% | 6.5% | -5.73% | -5.61% | -1.31% | 2.74% | 10.38% | 9.19% | 12.9% | Invest | |
| 76296.98 | 18 years | 0.02% | 1.01% | 4.34% | -6.06% | -6.33% | -1.74% | 3.01% | 14.17% | 13.2% | 13.99% | Invest | |
| 37808.31 | 29 years | 0.38% | 1.85% | 4.99% | -4.94% | -5.42% | -1.78% | 1.09% | 11.87% | 12.19% | 13.02% | Invest | |
| 415.75 | 31 years | -0.06% | 1.05% | 5.35% | -5.28% | -5.31% | -1.79% | -2.16% | 12.23% | 11.28% | 10.99% | Invest | |
| 2550.08 | 21 years | -0.74% | -0.36% | 4.91% | -3.89% | -4.01% | -1.94% | 0.55% | 12.94% | 11.3% | 12.58% | Invest | |
| 10516.39 | 27 years | 0.03% | 1.4% | 4.5% | -5.53% | -5.55% | -1.95% | 1.82% | 12.05% | 10.45% | 12.43% | Invest |


| Fund Name | AUM (Cr.) | Risk | 1W | 1M | 3M | 6M | YTD | 1Y | 2Y | 3Y | 5Y | 10Y |
|---|
| Fund Name | Jun-2026 | May-2026 | Apr-2026 | Mar-2026 | Feb-2026 | Jan-2026 | Dec-2025 | Nov-2025 | Oct-2025 | Sep-2025 | Aug-2025 | Jul-2025 |
|---|
| Fund Name | 2026-Q2 | 2026-Q1 | 2025-Q4 | 2025-Q3 | 2025-Q2 | 2025-Q1 | 2024-Q4 | 2024-Q3 | 2024-Q2 | 2024-Q1 | 2023-Q4 | 2023-Q3 |
|---|
| Fund Name | 2026 | 2025 | 2024 | 2023 | 2022 | 2021 | 2020 | 2019 | 2018 | 2017 | 2016 | 2015 | 2014 |
|---|
| Fund Name | AUM (Cr.) | Risk | 1W | 1M | 3M | 6M | YTD | 1Y | 2Y | 3Y | 5Y | 10Y |
|---|
| Fund Name | AUM (Cr.) | Initial NAV | Final NAV | NAV Change | Absolute Ret. | Annalized Ret. |
|---|
| Fund Name | AUM (Cr.) | Risk | 6M | 1Y | 2Y | 3Y | 5Y | 10Y | From Launch | |
|---|---|---|---|---|---|---|---|---|---|---|
| 3281.16 | High |
8.18%
|
11.01%
|
6.31%
|
8.32%
|
-
|
-
|
11.26%
|
Invest | |
| 213.25 | High |
3.15%
|
5.49%
|
4.87%
|
7.42%
|
-
|
-
|
10.92%
|
Invest | |
| 53527.40 | Low |
1.98%
|
0.95%
|
2.99%
|
6.46%
|
9.9%
|
12.33%
|
12.73%
|
Invest | |
| 1748.94 | High |
4.51%
|
3.47%
|
3.89%
|
8.06%
|
11.61%
|
13.17%
|
12.8%
|
Invest | |
| 2681.70 | High |
1.21%
|
-1.1%
|
1.28%
|
5.37%
|
9.52%
|
12%
|
15.09%
|
Invest | |
| 2000.94 | Moderate |
1.22%
|
-1.81%
|
1.67%
|
6.5%
|
10.52%
|
12.4%
|
11.27%
|
Invest | |
| 17.07 | Very High |
-
|
-
|
-
|
-
|
-
|
-
|
28.94%
|
Invest | |
| 739.03 | Average |
-
|
-
|
-
|
-
|
-
|
-
|
4.46%
|
Invest | |
| 1758.08 | Moderate |
-0.06%
|
-3.08%
|
-0.12%
|
4.43%
|
8.9%
|
11.42%
|
13.05%
|
Invest | |
| 50.56 | Moderate |
0.55%
|
-2.26%
|
0.34%
|
4.99%
|
9.38%
|
10.58%
|
9.91%
|
Invest | |
| 128.83 | High |
1.1%
|
-1.81%
|
1.24%
|
5%
|
8.9%
|
10.45%
|
10.82%
|
Invest | |
| 1471.25 | Very High |
0.4%
|
-2.13%
|
-
|
-
|
-
|
-
|
1.14%
|
Invest | |
| 51660.30 | High |
0.75%
|
-3.17%
|
1.21%
|
6.15%
|
12.46%
|
14.51%
|
14.07%
|
Invest | |
| 1170.63 | Low |
0.61%
|
-3.23%
|
0.97%
|
6.4%
|
-
|
-
|
9.1%
|
Invest | |
| 37692.41 | Low |
0.84%
|
-3.72%
|
0.45%
|
4.59%
|
7.95%
|
11.33%
|
14.16%
|
Invest | |
| 76296.98 | Very Low |
-0.41%
|
-5.35%
|
-0.1%
|
5.34%
|
10.94%
|
13.65%
|
14.22%
|
Invest | |
| 37808.31 | High |
0.08%
|
-4.37%
|
-1%
|
3.56%
|
9.61%
|
12.35%
|
17%
|
Invest | |
| 415.75 | Moderate |
0.48%
|
-3.66%
|
-1.66%
|
2.92%
|
8.93%
|
11.27%
|
10.7%
|
Invest | |
| 2550.08 | Low |
1.15%
|
-1.13%
|
0.35%
|
5.18%
|
10.04%
|
12.71%
|
12.95%
|
Invest | |
| 10516.39 | Moderate |
-0.15%
|
-4.75%
|
-0.18%
|
4.79%
|
9.11%
|
12.27%
|
14.11%
|
Invest |
| Fund Name | Risk | Standard Deviation | Alpha | Beta | Sharpe Ratio | |
|---|---|---|---|---|---|---|
| High |
18.21%
|
4.50%
|
1.15%
|
0.58%
|
Invest | |
| High |
16.29%
|
2.64%
|
1.08%
|
0.52%
|
Invest | |
| Low |
13.78%
|
-
|
0.94%
|
0.35%
|
Invest | |
| High |
15.70%
|
2.42%
|
1.06%
|
0.51%
|
Invest | |
| High |
14.81%
|
0.69%
|
1.01%
|
0.41%
|
Invest | |
| Moderate |
14.98%
|
1.72%
|
1.02%
|
0.48%
|
Invest | |
| Very High |
-
|
-
|
-
|
-
|
Invest | |
| Average |
-
|
-
|
-
|
-
|
Invest | |
| Moderate |
14.18%
|
0.10%
|
0.95%
|
0.36%
|
Invest | |
| Moderate |
14.55%
|
1.19%
|
0.95%
|
0.43%
|
Invest | |
| High |
14.52%
|
0.07%
|
0.98%
|
0.36%
|
Invest | |
| Very High |
-
|
-
|
-
|
-
|
Invest | |
| High |
14.15%
|
2.79%
|
0.96%
|
0.56%
|
Invest | |
| Low |
13.57%
|
2.11%
|
0.92%
|
0.52%
|
Invest | |
| Low |
14.14%
|
-
|
0.97%
|
0.28%
|
Invest | |
| Very Low |
13.51%
|
2.73%
|
0.92%
|
0.57%
|
Invest | |
| High |
14.01%
|
0.18%
|
0.95%
|
0.38%
|
Invest | |
| Moderate |
15.45%
|
0.90%
|
1.02%
|
0.41%
|
Invest | |
| Low |
14.73%
|
1.82%
|
1.00%
|
0.49%
|
Invest | |
| Moderate |
14.18%
|
0.28%
|
0.97%
|
0.39%
|
Invest |
| Fund Name | Min SIP | Min Lumpsum | Expense Ratio | Fund Manager | Launch Date | |
|---|---|---|---|---|---|---|
|
₹1000
|
₹5000
|
1.96%
|
Sanjeev Sharma
|
08-Aug 2022
|
Invest | |
|
₹1000
|
₹5000
|
2.05%
|
Dhruv Bhatia
|
24-Jun 2021
|
Invest | |
|
₹500
|
₹5000
|
1.43%
|
Saurabh Pant
|
14-Feb 2006
|
Invest | |
|
₹100
|
₹1000
|
1.78%
|
Amit Nigam
|
21-Aug 2009
|
Invest | |
|
₹100
|
₹5000
|
1.69%
|
Abhinav Sharma
|
07-May 1998
|
Invest | |
|
₹100
|
₹1000
|
1.76%
|
Sumit Agrawal
|
09-Jun 2006
|
Invest | |
|
₹100
|
₹100
|
0.58%
|
|
18-May 2026
|
Invest | |
|
₹1000
|
₹1000
|
0.48%
|
|
06-Feb 2026
|
Invest | |
|
₹500
|
₹5000
|
1.78%
|
Neelotpal Sahai
|
10-Dec 2002
|
Invest | |
|
₹500
|
₹500
|
2.08%
|
Ankit Tikmany
|
19-Sep 2025
|
Invest | |
|
₹500
|
₹500
|
2.42%
|
Anupam Tiwari
|
10-Feb 2012
|
Invest | |
|
₹500
|
₹500
|
1.82%
|
Nimesh Chandan
|
23-Aug 2024
|
Invest | |
|
₹500
|
₹100
|
1.23%
|
Sailesh Raj Bhan
|
08-Aug 2007
|
Invest | |
|
₹100
|
₹500
|
1.88%
|
Piyush Baranwal
|
01-Dec 2022
|
Invest | |
|
₹99
|
₹5000
|
1.31%
|
Gaurav Misra
|
04-Apr 2008
|
Invest | |
|
₹500
|
₹100
|
1.14%
|
Anish Tawakley
|
23-May 2008
|
Invest | |
|
₹100
|
₹100
|
1.53%
|
Rahul Baijal
|
11-Oct 1996
|
Invest | |
|
₹100
|
₹1000
|
2.1%
|
Satish Ramanathan
|
01-Apr 1995
|
Invest | |
|
₹250
|
₹5000
|
1.7%
|
Jitendra Sriram
|
23-Sep 2004
|
Invest | |
|
₹100
|
₹100
|
1.76%
|
Arjun Khanna
|
29-Dec 1998
|
Invest |
| Fund Name | Current NAV | Previous NAV | 1D NAV Change | 52- Week High NAV | 52- Week Low NAV | |
|---|---|---|---|---|---|---|
|
15.6983
(25-06-2026)
|
15.6645
(24-06-2026)
|
0.22%
|
15.759
|
12.9951
|
Invest | |
|
16.63
(25-06-2026)
|
16.66
(24-06-2026)
|
-0.18%
|
16.98
|
14.73
|
Invest | |
|
94.3946
(25-06-2026)
|
94.1900
(24-06-2026)
|
0.22%
|
97.3744
|
83.7944
|
Invest | |
|
70.73
(25-06-2026)
|
70.65
(24-06-2026)
|
0.11%
|
72.11
|
61.13
|
Invest | |
|
505.2351
(25-06-2026)
|
504.5104
(24-06-2026)
|
0.14%
|
532.196
|
452.006
|
Invest | |
|
76.893
(25-06-2026)
|
76.868
(24-06-2026)
|
0.03%
|
81.237
|
69.437
|
Invest | |
|
10.0974
(25-06-2026)
|
10.0834
(24-06-2026)
|
0.14%
|
10.1131
|
9.6125
|
Invest | |
|
9.5775
(25-06-2026)
|
9.5650
(24-06-2026)
|
0.13%
|
10.1113
|
8.7101
|
Invest | |
|
471.8624
(25-06-2026)
|
470.0568
(24-06-2026)
|
0.38%
|
501.508
|
431.86
|
Invest | |
|
155.55
(25-06-2026)
|
155.57
(24-06-2026)
|
-0.01%
|
164.4
|
143.74
|
Invest | |
|
42.76
(25-06-2026)
|
42.61
(24-06-2026)
|
0.35%
|
44.78
|
38.62
|
Invest | |
|
9.941
(25-06-2026)
|
9.914
(24-06-2026)
|
0.27%
|
10.496
|
9.158
|
Invest | |
|
90.0282
(25-06-2026)
|
89.8939
(24-06-2026)
|
0.15%
|
94.7726
|
81.5095
|
Invest | |
|
14.648
(25-06-2026)
|
14.624
(24-06-2026)
|
0.16%
|
15.537
|
13.333
|
Invest | |
|
111.232
(25-06-2026)
|
111.129
(24-06-2026)
|
0.09%
|
118.556
|
99.677
|
Invest | |
|
108.44
(25-06-2026)
|
108.19
(24-06-2026)
|
0.23%
|
116.62
|
99.87
|
Invest | |
|
1119.447
(25-06-2026)
|
1116.034
(24-06-2026)
|
0.31%
|
1194.96
|
1019.47
|
Invest | |
|
151.0667
(25-06-2026)
|
150.723
(24-06-2026)
|
0.23%
|
160.808
|
136.998
|
Invest | |
|
217.5251
(25-06-2026)
|
217.7334
(24-06-2026)
|
-0.1%
|
228.559
|
198.584
|
Invest | |
|
562.298
(25-06-2026)
|
560.866
(24-06-2026)
|
0.26%
|
599.496
|
514.754
|
Invest |

Large Cap Funds Return Calculator
Historical Returns
Future Value
Invested Amt.
+Net Profit
=Total Wealth
- Invested Amount
- Estimated Returns
- Invested Amount ₹43,855
- Interest Earned ₹6,145
Explore Other Popular Calculators
Join 50,000+ Investors Who Tested Their Suitability
Are Large Cap Funds Suitable for You?
 Suitability Test?
Check Suitability of Large Cap Funds for your Portfolio
 Suitability Result


Comparison of Top Large Cap Funds
 Kotak Large Cap Fund - Growth
3Y Returns 12.05%
VS
Kotak Large Cap Fund - Growth
3Y Returns 12.05%
VS
 Canara Robeco Large Cap Fund - Regular Plan - Growth Option
3Y Returns 11.54%
Canara Robeco Large Cap Fund - Regular Plan - Growth Option
3Y Returns 11.54%
 Edelweiss Large Cap Fund - Regular Plan - Growth Option
3Y Returns 10.92%
VS
Edelweiss Large Cap Fund - Regular Plan - Growth Option
3Y Returns 10.92%
VS
 Nippon India Large Cap Fund- Growth Plan Bonus Option
3Y Returns %
Nippon India Large Cap Fund- Growth Plan Bonus Option
3Y Returns %
 HDFC Large Cap Fund - Growth Option - Regular Plan
3Y Returns 11.87%
VS
Nippon India Large Cap Fund- Growth Plan Bonus Option
3Y Returns %
HDFC Large Cap Fund - Growth Option - Regular Plan
3Y Returns 11.87%
VS
Nippon India Large Cap Fund- Growth Plan Bonus Option
3Y Returns %
 Sundaram Large Cap Fund Regular Plan - Growth
3Y Returns 9.5%
VS
Canara Robeco Large Cap Fund - Regular Plan - Growth Option
3Y Returns 11.54%
Sundaram Large Cap Fund Regular Plan - Growth
3Y Returns 9.5%
VS
Canara Robeco Large Cap Fund - Regular Plan - Growth Option
3Y Returns 11.54%
Advantages of Large Cap Mutual Funds
Investing in large cap mutual funds comes with several benefits:
-
Steady Growth
The large cap funds invest in well-established biggest companies that have a history of steady growth. This makes them a safer choice via SIP for those who prefer less risk in their mutual fund investments.
-
Easy to Buy and Sell
Since these companies are big and popular, large-cap funds are traded in high volumes. This means you can easily sell your investment without worrying about the value changing too much.
-
Regular Dividends
Many large-cap companies pay dividends regularly. This gives you a chance to earn extra income, in addition to any increase in the value of your investment.
Pro Tip: Try out the SIP Calculator to know your future returns beforehand.
Best Large Cap Mutual Funds to Invest in 2026
Let us have a closer look at the 3 best performing large cap mutual funds in India:
-
Nippon India Large Cap Fund
The Nippon India Large Cap Fund, launched in 2007, is one of the oldest & most reliable large cap funds, managing Rs.41,764 Crores as of June 2026. It focuses on investing in companies with strong growth potential and competitive advantages, consistently beating its benchmark.
-
ICICI Prudential Bluechip Fund
The ICICI Prudential Bluechip Fund, started in 2008, is another trusted name, with Rs.69,755 Crores in assets. It combines value and growth strategies while managing risk, making it a good option for conservative investors.
-
Bandhan Large Cap Fund
The Bandhan Large Cap Fund, though relatively smaller in size, has made strong growth since Mr.Manish Gunwani took over its management. This large cap fund specializes in investing in high-quality companies with strong corporate governance while striving for improved returns via concentrated portfolio holdings. It is best suited for research-driven management strategies in large cap stocks with its annualized return of 12.211% since inception.
Also Read: Top large cap mutual funds handpicked by experts for 2026.
Difference Between Large Cap, Mid Cap & Small Cap Mutual Funds
The main difference between large, mid and small cap mutual funds lies in their market capitalization. The Securities and Exchange Board of India has categorized Mutual Funds based on their market cap.
Companies ranking between 1 to 100 are large cap mutual funds, mid cap mutual funds range between 101-250th and beyond that 250th are the small cap mutual funds.
The below table summarizes the key differences between large, mid and small caps for you:
| Points of Difference | Large Cap Funds | Mid Cap Funds | Small Cap Funds |
|---|---|---|---|
| Company Size | Top 100 companies | 101-250 companies | 251 and beyond |
| Growth Potential | Established, well-known companies | Growing businesses with potential | Emerging companies in the early stages |
| Average 5-year Return | Average 5-years return is 15.16% | Average 5-years return is 22.42% | Average 5-years return is 26.22% |
| Volatility | Low volatility | More volatile than large caps | Highly volatile |
To learn more, read our detailed guide on Small Cap vs Mid Cap vs Large Cap Funds: Which is Best?
How Much Tax do You have to Pay on Large Cap Mutual Funds?
As per the New Tax Regime 2026, the tax you pay on large cap mutual funds depends on how long you have held them:
- Short-Term Capital Gains (STCG): If you sell your large-cap mutual funds within 12 months, you will pay a tax of 20% on the gains.
- Long-Term Capital Gains (LTCG): If you hold your investment for more than 12 months, there is no tax on gains up to Rs.1.25 lakh per financial year. Any amount above that is taxed at 12.5%.
| Capital Gains Tax | Holding Period | Old Rate | New Rate |
|---|---|---|---|
| Short-term capital gains (STCG) | Less than 12 months | 15% | 20% |
| Long-term capital gains (LTCG) | More than 12 months | 10% | 12.50% |
So, the tax rate is based on your holding period and the amount of profit you make.
Pro Tip: Break down hours of calculation to minutes using the Tax Calculator now.
Factors to Consider Before Investing in Large Cap Mutual Funds
Before you invest in large cap mutual funds, here are a few things to keep in mind:
-
Moderate Returns than Small Caps
Large-cap funds tend to offer stable returns, but they usually do not provide the high returns you might see with small-cap or mid-cap funds. These funds invest in well-established companies, so the growth is steady but not explosive.
-
Market Fluctuations
Even though large-cap funds are considered safer, they can still go up and down with market changes. They carry some risk, just like any equity-based investment.
-
Best for Long-Term
These funds typically perform better when held for a longer time. If you are looking for short-term gains, large mutual cap funds may not be the best fit. They’re more suitable for those who are willing to invest for several years.
Must Read: 11 Common Mistakes to Avoid While Investing Mutual Funds
Frequently Asked Questions
As defined by the SEBI, a large cap fund invests at least 80% of its money in large-cap stocks of the top 100 companies by market cap in India, with a small portion in mid-cap stocks to improve returns on investments.
The Large cap mutual funds carry the least amount of risk compared with mid- or small-cap funds, as they invest in bluechip stocks with established companies and stable earnings.
You can expect stable and consistent returns from large cap mutual funds. Historically, the Nifty 100 total return index (TRI) has shown a 15.16% average CAGR in the last 5 years.
If you seek stable returns with lower risk, then planning your investment in the best large cap mutual funds for at least 5-7 years is the ideal choice. Plus, if you start a SIP, you get compounding returns with long-term growth.
You can check the performance by comparing the fund's returns with its benchmark index, looking at the CAGR (Compound annual growth return), or the intended internal rate of return (XIRR).
Explore Other Categories
By Market Capitalization
By Diversification
By Sector & Themes
Top Videos and Blogs on Large Cap Mutual Funds
Videos
Blogs
 Large Cap or Small Cap? | The Real Answer for Mutual Fund Investors in 2026
 Small cap v/s Large cap mutual funds| Small-Cap Mutual Fund for long term?
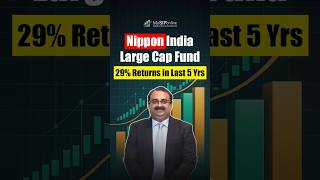 Nippon India Large Cap Fund Review | Best Large Cap Fund to Invest in 2025?
 SIP Mutual Funds Returns in 2021| Top & Bottom - Large Cap, Mid cap & Small Cap Sip Funds
 Top 5 Large Cap Funds for 2021 | Best Mutual Funds in 2021 | Best Mutual Fund for beginners
 Large Cap vs Mid Cap vs Small Cap Mutual Funds | Performance of Mutual Funds
 Best Large Cap Mutual Funds | Comparison of Top 7 Large Cap Funds 2023 | By Mutual Fund Analyst
 You can select three funds for compare.


