Defining Performance Analysis
The performance analysis refers to the process by which the fund’s overall performance in terms of returns, management, etc., is evaluated in comparison with the set objectives. Here in this research paper, our analysts have made an attempt to scrutinise the past data such as annual returns, trail returns, SIP returns, and return trends in different markets of the large-cap mutual funds in order to examine their overall performance in different market scenarios irrespective of the types of risk involved in them.
By analysing the performance of the various large cap funds of different AMCs, our researchers have presented a detailed report to let you understand the efficiency of the funds in varying market situations to produce expected returns. We have mentioned the analysis of the best recommended large-cap funds as well to help you make the right choice of fund for your portfolio.
Performance of Large Cap Funds- Annual Returns
The annual returns of the large cap mutual fund depict the performance or profits generated by the schemes in one calendar year starting from January 1 to December 31. The returns are computed as a difference between the NAV of the scheme as on the first and the last day of the calendar year.
For Example, The NAV of a scheme named ABC amounted to Rs.8 as on 1st January 2016, and Rs.12 as on 31st December 2016, being the opening and closing NAV of ABC. The annual returns of the scheme will be computed as -
Closing NAV - Opening NAV,
i.e., 12 - 8 = Rs.4 per unit.
Analysis of Annual Returns
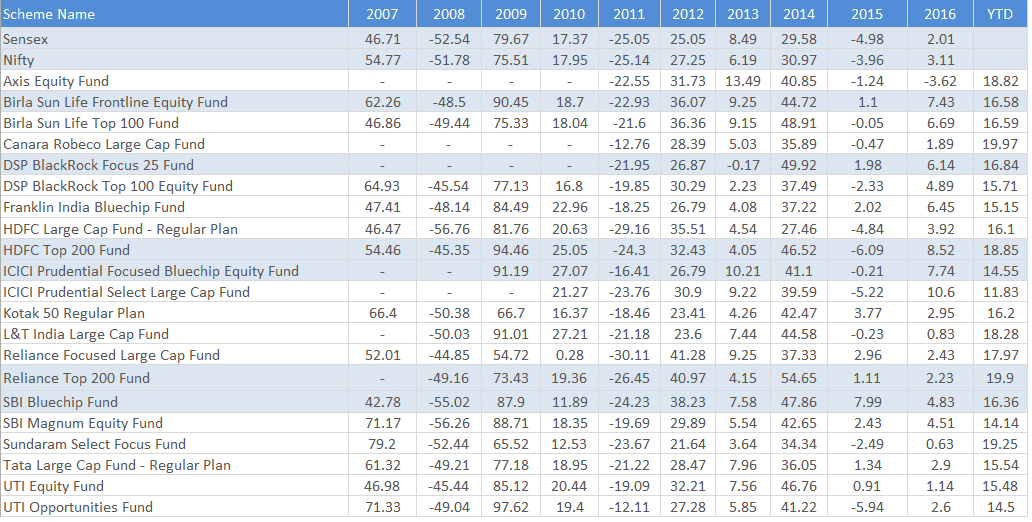
The return report is for the period of total ten years starting from 2007 to 2016, along with the year-to-date performance of the schemes, i.e., from January 01, 2017 to May 17, 2017. Our research analysts have measured the performance of the funds as against the benchmark so as to generate an adequate result. With the help of this data, one can easily understand the performances of the large-cap funds in the different years. The trends can be analysed by viewing the differences between the benchmark and annual returns to understand how high or low the funds have been with the benchmark going up or down. The table depicts the return values of the various large-cap funds in different years and showcases the trends against the benchmarks.
As per the data, it can be well evaluated that out of the total ten years period, only three years have been those where the market trends were negative, and the investors who had invested in such scenarios would have faced negative profits.
From March 2016, the market has been showing positive trends regularly with small variations or fluctuations. Hence, the year-to-date returns of the fund from January 2017 to May 17, 2017, almost all the large-cap funds have given more than 15% returns.
The table also depicts the highest (2009 & 2014) and lowest (2008 & 2011) markets in the past ten years and the performance of the large-cap schemes in such scenarios.
The top recommendations of our fund analysts which include Birla Sun Life Frontline Equity Fund, DSP BlackRock Focus 25 Fund, HDFC Top 200 Fund, ICICI Prudential Focused Bluechip Equity Fund, Reliance Top 200 Fund, and SBI Bluechip Fund had generated tremendous profits with very high margins even when the market was down.
ICICI Prudential Focused Bluechip Equity Fund & Birla Sun Life Frontline Equity Fund have given returns of 10.21% and 9.25% in the year 2013 as against 8.49% and 6.19% of the Sensex & Nifty.
In the year 2015 when the market indices were in negative trends, schemes like DSP BlackRock Focus 25 Fund, Reliance Top 200 Fund, and SBI Bluechip Fund generated positive returns with very good margin
Thus, you can conclude here that large-cap funds have been outperforming the market indices with very good margins and the fund recommendations by our analysts were the best performers of all time.
Large Cap Mutual Funds - Trail Returns
The trail returns are the best way to evaluate fund’s performance as they depict the yields produced by the funds in the running market as on the current date. These are the returns which are calculated as a percent change in the NAV from the current date to any previous date or period.
For Example-
Present day NAV of a scheme is Rs.15, and the NAV of the same fund a month ago was Rs.10, then the trailing returns will be computed as -
15 - 10/ 10 * 100 = 50% (Trailing Return)
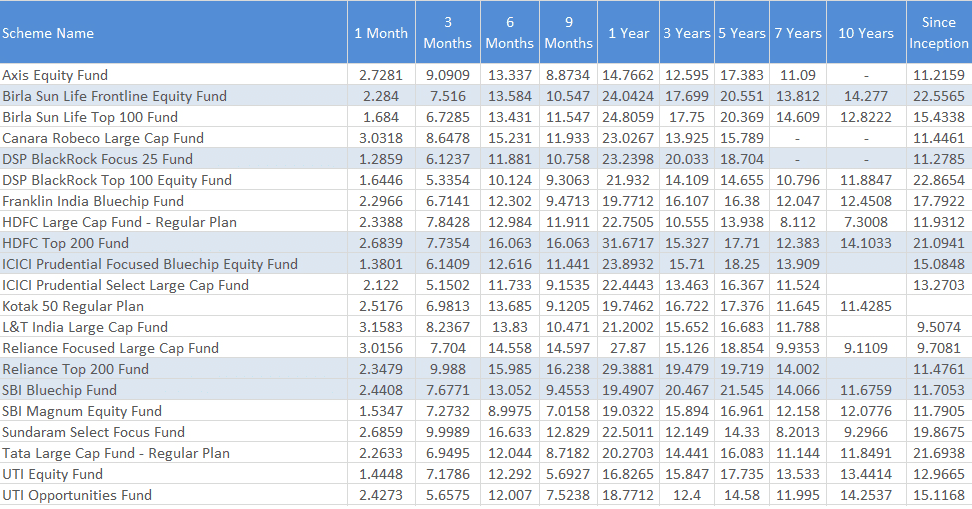
Analysis of Trail Returns
Trail Return is the best way to analyse fund’s performance as it depicts the current performance of the funds as per the market scenario in terms of any particular period. The trail returns are computed every day to measure the exact performance of the fund as on that date in order to understand the trends of the funds in the running market. The analysis report by our analysts in terms of trail returns showcases the best trending funds in different investment tenures as per the trailing returns of large-cap funds. The trends in the large-cap funds can be understood in two different scenarios.
Short-Term Period -
Here, the analysts have analysed the funds in the past one year period to evaluate the behaviour of the funds while comparing them with the existing market.
- 100% Paperless
- No Transaction Charges
- Easy to Invest
- Safe & Secure
The past one year returns depict that market has raised with great margin, where almost every fund has offered more than 20% returns. Our recommendations, viz., HDFC Top 200 Fund and Reliance Top 200 Fund have been the highest performers with 31.67% and 29.38% returns respectively.
The past three, six, and nine months returns are though in the positive trends, are lower in comparison with the past one year returns which shows that last year began with a highly positive market and then faced fluctuations and negative trends making the returns lower in values.
Long-Term Period -
The long-term trail returns are helpful in analysing annualised returns of the funds in the past three or more years.
The returns in the long duration are averaged out and tend to remain positive most as the losing money is reduced with time. The negative trends are balanced or averaged in the long-term positive cycle.
In the long run, as well, the market scenario changes which leads to fluctuating the values or returns due to which there is variability in the returns of the funds in three, five, and seven years tenure.
Our recommendations in the large-cap funds can be viewed with outperforming returns in all the market scenarios while dealing with the fluctuations. The trail returns for funds like Birla Sun Life Frontline Equity Fund & SBI Bluechip Fund have given 20.55% and 21.54% returns for the five-year duration.
Trail Returns Since Inception
The trail returns of the large-cap funds as on May 17, 2017, depict overall performance of the schemes after their launch until date. All the funds have performed tremendously while beating the market volatility and have given high-growth returns. Our recommendations including Birla Sun Life Frontline Equity Fund and HDFC Top 200 Fund have given more than 20% returns showcasing high trends in performance as per the current scenario.
Performance of Large-Cap Funds in Different Market Scenarios
The mutual fund investment market faces two different phases due to the fluctuations in the stock values due to which their returns can be predicted. The following analysis depicts the performance of the large-cap funds in bull and bear market.
Bullish Market - This is the period when the market shows favourable trends due to which the returns on the investments remain positive and are gradually increased.
Bearish Market - This is the scenario where the market tends to showcase traction in the prices which results in fluctuating the returns making them negative most of the times.
In the table below the performance of large-cap mutual funds is showcased in two different period, where one is bearish and other is bull.
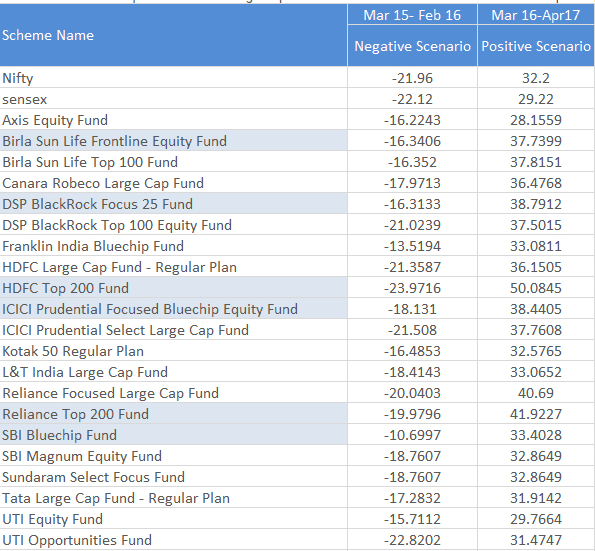
Analysis of the Data
From March 2015 to February 2016 was the negative or bearish market, while from March 2016 to April 2017 is the positive or the bullish market. Let’s analyse the returns of the funds in different markets.
In the bearish phase of almost around a year, the benchmarks were on the negative trends. Although all the large-cap schemes showcased negative returns, there were some schemes which beat the market by considerable margins. HDFC Top 200 Fund was the outperformer with (-)23.97% returns as against (-)21.96% Nifty & (-)22.12% Sensex indices.
The funds with highly negative returns are those with maximum risk exposure which get affected by the market fluctuations.
In the bullish phase of the market where benchmarks were set on the positive trends, the large-cap funds outperformed the market with high margins.
The funds recommended by our experts, viz., Reliance Top 200 Fund, HDFC Top 200 Fund, Birla Sun Life Frontline Equity Fund are the top gainers with returns in the range of 30% to 50%.
In the positive trends, the schemes showcasing the high-margin returns are those which have enough capacity to generate exceptional profits for the investors.
To conclude by analysing the conservative class including Birla Sun Life Frontline Equity Fund, DSP Blackrock Focus 25 Fund with strong risk management hold better returns in the negative trend; and outperformed the positive market with excellent margins. However, the portfolio of DSP Blackrock Focus 25 Fund depicts that the scheme has moderate to high-risk profile with a strategy of holding stocks having high bet in the market.
SIP Returns
Meaning - The SIP returns are the profits generated by the funds from the investments which are made on a regular basis through Systematic Investment Plan for different tenures
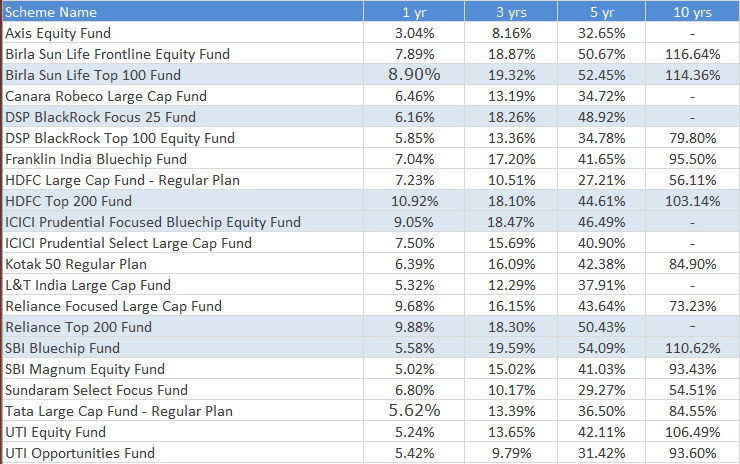
Analysis of the Data
The investments through SIP are very beneficial for the investors. Though in the short run they do not perform that high due to market fluctuations, in the long run, they produce exceptional profits for the investors.
- 100% Paperless
- No Transaction Charges
- Easy to Invest
- Safe & Secure
The one-year returns for SIP in large cap funds are lower due to the high rate of volatility present in the market affecting the overall values.
The three years returns are notable, but the five-years returns’ performance is remarkable being the double of the three-year profits, showcasing the effect of the long-term investment horizon.
Considering the ten years returns, it is proved that SIPs are made for a longer tenure as they beat the volatility to produce returns more than 100%. The large cap SIP schemes have shown excellent growth in the long run.
Our recommendations including HDFC Top 200 Fund and SBI Bluechip Fund have offered returns greater than 100% of the values in the long-term period.
Accordingly, in the case of SIP returns the investment tenure has the greatest importance. When the market is on the positive trends in the short-term, the returns shall be positive, but if the market falls, the returns are affected extremely.
In the long-term investment tenure, the schemes offer excellent profits as the market volatility is averaged-out resulting in generating positive trends with tremendous growth along with the benefit of rupee-cost averaging.
Risk Analysis
Definition of Risk
Risk implies the future uncertainty regarding deviation from expected earnings or expected outcome. In the case of mutual fund investments, risk measures the uncertainty that an investor is willing to take to realise a gain.
Furthermore, the risk is divided into two forms; one is related to the fear of losing money; wherein there are chances of losing the principal amount invested for accomplishing the financial goals. On the flip side, the other fear is related to the market volatility which tends to fluctuate the returns on the schemes.
Market volatility is nothing but the fluctuations in the market indices due to several factors which lead to either positive or negative trends in the returns generated by the large-cap mutual funds. High volatility means the returns fluctuate with high margins, and low volatility means the returns fluctuate with low margins.
The large-cap funds are classified in the moderate risk funds in the equity category which generates stable returns and consistent growth while managing the market fluctuations. In the case of the volatile market, the returns of large-cap schemes are affected but with a low margin and tend to remain stabilised. We have used the statistical tools, i.e., Standard Deviation and Beta to analyse the risk appetites of the funds in different market situations.
Standard Deviation - The standard deviation is a statistical tool used to measure the variations in the values of the returns generated by the funds about their average returns. For example, if the average return value of a fund is 10%, and the standard deviation of the same fund is 20%, then the chances of variation in the returns value of the fund will be either 20% higher or 20% lower. This means that whether the fund will have 12% returns or 8% returns as per the market moves.
Beta - The beta value of a fund demonstrates the change in the values of a fund in relation to the change in the market indices. It is a measure which is used to calculate the systematic risk of a fund. If the beta of the fund is less than 1, it shows that the fund is less volatile than the market, and if the beta is more than 1, it shows that the fund is more volatile than the market. For example, if a fund’s beta is 1.2, then it is 20% more volatile than the market, and if the beta is 0.80, then the fund is 20% less volatile than the market.
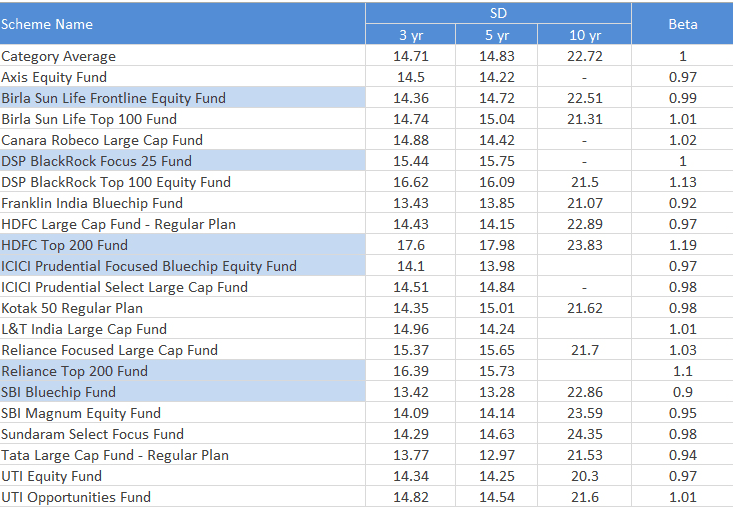
Risk Analysis of Large-Cap Funds
The standard deviation of the large-cap mutual funds varies in different investment tenures of three, five and ten years.
The individual risk levels of the schemes can be depicted with the standard deviations showcasing the rate of volatility in the funds in comparison with the market benchmark.
The funds which have a high standard deviation are high-rewarding funds in the positive trends but carry comparatively a high degree of risk.
The beta factor which demonstrates the level of volatility in a fund in relation to the market is greater than 1 in the case of some of the funds which shows that they are comparatively riskier. However, they are also the highest performers at a time when the investment market shows positive trends.
The best recommendations by our experts can be analysed that they have considerable risk factors. HDFC Top 200 Fund has beta 1.19 with standard deviation being 23.83 which show that though the fund is riskier but has the potential to generate exceptional profits in the positive market scenario.
Conclusion
Risk and returns are complementary in nature, and it can be analysed here that the large-cap funds are moderately risky and generate stable or consistent returns for the investors. By analysing the data available here, investors can easily opt for the funds which suit their risk appetite and investment horizon
 Retirement Planning Fund
 Best Tax Saving Funds
 Child Future Planning Funds
 Smart Saving Account
 Top Performing Funds
 New Fund Offer (NFO)

.webp)
 2155
2155  7 Min. Read
_(1).webp)
.webp)
_(1).webp)