In mutual fund investments, performance analysis refers to analysing the past data of the mutual fund schemes in order to evaluate how they have performed in different market scenarios irrespective of the risk involved in the funds. By analysing the returns generated in the past, we cannot guarantee the future profits of the scheme but can analyse the potential of the fund to perform in the prospective market.
Defining Performance Analysis
Our core research team has analysed the performance of various ELSS mutual funds from different AMCs to present detailed reports regarding the efficiency of the funds to generate expected returns in different market scenarios even in the volatile market.
Here in this Performance Analysis, we have covered the following major traits to produce fool-proof track records of ELSS funds along with the risk appetites of the schemes to understand how much they have returned irrespective of the market fluctuations.
To analyse the capabilities of a student, we check their past report cards just to get an idea how he has been in different subjects and how he has performed until now. Similarly, by analysing the past data of the mutual fund schemes, we get an idea about the fund’s potential though it does not guarantee any future returns.
- Annual Returns
- Trailing Returns
- Analysis of ELSS Returns in Different Market Scenarios
- SIP Returns
1. Annual Returns
Meaning - The annual returns are the profits earned by the investors in a period of one calendar year, i.e., from January 1st to December 31st of a particular year. They are computed on the basis of the difference between the opening NAV of a fund on January 1st and the closing NAV of the fund on December 31st.
For example - The NAV of a scheme named XYZ amounted to Rs.10 as on 1st January 2016, and Rs.16 as on 31st December 2016, being the opening and closing NAV of XYZ. The annual returns of the scheme will be computed as -
Closing NAV - Opening NAV,
i.e., 16 - 10 = Rs.6 per unit.
Analysis of Annual Returns
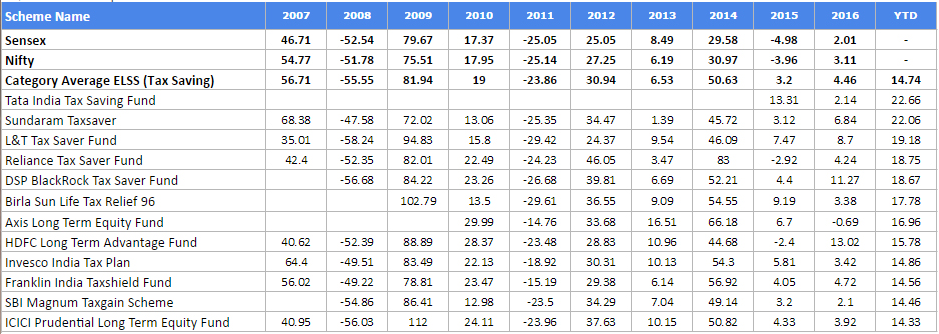
Our fund analysts have analysed various ELSS schemes of different fund houses for a period of 10 years starting from 2007 to 2016. Furthermore, in the analysis report above we have showcased the year-to-date (YTD)returns of the scheme as well, i.e., from January 01, 2017 to May 01, 2017. The performance of the schemes has been measured as against the benchmarks, i.e., Nifty & Sensex as well as the ELSS category.
- Beginning from the year 2007, you can evaluate that Sundaram Tax Saver beat the market by a great margin, and its performance as against the category’s average was almost 20.57% higher.
- Again in the year 2009 to 2014, you can see that there were schemes which performed tremendously in the market fluctuations and beat the indices and category with very good margins.
- In the year 2015, when the market was down with negative indices, and category’s average was also on the negative trend, Tata India Tax Saving Fund showcased excellent returns, i.e., 13.31% beating the benchmarks with superior margins.
- The year-to-date returns (up to 01 May 2017) of schemes like Tata India Tax Saving Fund and Sundaram Tax Saver Fund performed very nicely and generated returns with good margins, i.e., almost around 53%.
- The risk and returns factors of the schemes can be analysed with the negative returns generated by them in the past.
- In the past ten years, the market went negative thrice, i.e., in the years 2008, 2011, and 2015. The year 2008 was the worst of all where the market went down by almost 50%, but some of the schemes like L&T Tax Saver Fund, Invesco India Tax Plan beat the market and category with very good margins.
- Regarding volatility, ELSS funds are considered to be moderate due to the diversified investments of the capital.
- Lowest lock-in period of 3 years
- Better returns compared to PPF/FD
- Get instant investment proof
2. Trailing Returns
Meaning - The trailing returns are the returns calculated from the prevailing date to any previous date by considering the difference between current NAV and any previous day’s NAV.
Suppose you have to calculate the trailing returns for past one month. It will be calculated from today’s date says March 25 to past one month’s date, i.e., February 25. This will show how the fund has performed in the recent past one month and what returns it has generated until date. The trailing returns are calculated every day to know the current performance of the scheme as per the market scenario and to evaluate how it is responding to the market in the present time.
Trailing returns are beneficial for the investors as they tell the exact updated value of the investments for a particular period. They are used to calculate the returns generated by the schemes in one block of time in the running market which may be one month, one year, five years, or since inception. It is computed by taking the percentage change in the NAVs from current date to any previous date.
For Example - Present day NAV of a scheme is Rs.15, and the NAV of the same fund a month ago was Rs.10, then the trailing returns will be computed as -
15 - 10/ 10 * 100 = 50% (Trailing Return)
How to Check Trailing Returns?

The trail returns are considered to be the best tool for evaluating fund’s current market performance as per the scenario. Keeping the same things in mind, our core researchers have generated a report on trailing returns where they have showcased the trending funds in different investment tenures on the basis of trailing returns as on May 01, 2017. If you want to understand how you can evaluate the fund’s performance, you can understand the trailing returns considering the following analysis –
- The returns shown in a period of less than one year, i.e., one month, three months, etc., are showing the latest trends of the market as they are the returns of the recent time frame. On the flip side, where the period of investment is more than three years, the performance of the funds are shown in the long run. The trail returns since inception depict the overall profits generated by the schemes since their launch. The market faces different trends say bullish and bearish and the returns are fluctuated accordingly. So, trailing returns are the best tool to evaluate the overall performance of the funds in different time frames while dealing with market volatility.
- In the last one year, the market has although given positive returns, the returns have found some negative trends as well due to which the profits in the past six and three months are contracting. The past three months returns are greater in respect to past six-month returns. By analysing the report it can be evaluated that in the starting three months of the six-month investment tenure, the market must have been on the negative trend, and then later in the past three-four months it became positive due to which the average returns in six months are less than the three months returns when the market was rising purely.
- The last one year period was a bullish market, as the returns are seen high in rates. This depicts that the beginning of the past one year started with a low market, which in further months was recorded on the positive side giving bullish returns.
- In the long run, i.e., for a period of more than three years, the returns depict that though market administered various fluctuations, the returns generated were positive irrespective of the volatility.
- The trail returns could be useful for the investors as they can evaluate the exact current value of their investments if they had invested their money in the past. Say, if you had invested your money in any of the ELSS schemes three years ago from now, then you would be able to compute the exact worth of your investment.
- The best way to analyse the overall performance of the fund, the trailing returns since inception should be considered by the investors to know how the fund has been performing since their existence.
Note 1. - The data presented in the table is calculated up to May 01, 2017.
Note 2. - The returns calculated by our researchers are absolute for investments until one year and annualised for more than one year.
Conclusion & Suggestion
Our core research team has analysed the market trends in an in-depth manner, and we recommend investors that they must consider the trailing returns to evaluate the monthly or yearly trends of the funds as per market scenario.
Also it is suggestible that in short run fluctuation of positive and negative is very high but the same has been compensated in long run.
Different Market Scenarios
Mutual fund industry faces different situations as per the stock market’s fluctuations, and thus the investments in mutual funds are considered subject to market risk. The market is divided in two form, i.e.,
Bullish Market - This is the period when the market shows positive trends whereby the returns on the investments remain positive and are gradually increased.
Bearish Market - This is the scenario where the market tends to showcase traction in the prices, which result in fluctuating the returns making them negative most of the times.
- 100% Paperless
- No Transaction Charges
- Easy to Invest
- Safe & Secure
3. Analysis of ELSS Returns in Different Market Scenarios

The analysis of the returns of ELSS funds has been made to evaluate their performance in the negative and positive market situations. Our experts have analysed the data of the past two years, i.e., from 2015 to 2017.
- The period of almost around one year starting from March 2015 to February 2016, the market was in the bearish phase and indices being on the negative side. In the report analysis, it can be analysed that the ELSS schemes like Tata India Tax Saving Fund, L&T Tax Saver Fund, Franklin India Taxshield Fund have been on the negative trend, but have beaten the market with very good margin.
- In the bullish market trend, i.e., in between March 2016 to April 2017, it can be analysed that the market was overall on the positive scale where the scheme returned profits with a high margin being almost around 50%.
- With this, it can be understood that though the market went negative for a continuous period as shown in the table, the returns in the next phase were notable where they aggregated the values of the investments with high margins.
4. SIP Returns
Meaning - The SIP returns are the profits generated by the funds in which the investments are made on a regular basis through Systematic Investment Plan for different tenure.
Analysis of SIP Returns

The SIP returns in the short-term, i.e., in the period of one year, the returns are comparatively lower due to the market volatility involved.
- In the three and five years, the SIP returns of the schemes have almost doubled showing the impact of the power of compounding.
- The ten years SIP returns of the scheme are excellent being more that 100% in many schemes. The compounding returns have made the investments highly affluent providing exceptional profits in the category.
- The risk involved in SIP is in the short-term only, but in the long tenure the funds have showcased extremities due to the power of compounding on the one hand, and the rupee-cost averaging on the other.
Accordingly, the data can be concluded in the following forms:
- When the market is positive in the short duration, then the funds perform extremely good and offer tremendous growth in capital. But, if the market falls the returns are strongly hit.
- In the long-term tenure, the schemes offer excellent returns performance not only in the positive market but the negative scenario as well they tend to offer consistent profits due to the rupee-cost averaging.
Definition of Risk
The risk in general parlance is defined as the occurrence of an uncertain event. In the case of mutual funds, the risk is divided into two forms. One is related to the fear of losing money; wherein there are chances of losing the principal amount invested for accomplishing the financial goals. On the flip side, the other fear is related to the market volatility which tends to fluctuate the returns on the schemes either positively or negatively.
Market volatility regarding risk is defined as the fluctuations in the market indices due to several factors which lead to either high fluctuation or low fluctuation in the returns generated by ELSS funds. High volatility means the returns fluctuate with high rates, and low volatility means the returns fluctuate with low rates.
ELSS Funds are categorised in the moderately high-risk mutual funds as when the funds are high volatile, the rewards or the returns are also very high. The risk of the fear of losing money during the initial investment years totally depends on the market behaviour; the statistical tools can be utilised to measure the same to know the level of risk involved in the scheme. The various tools that can be helpful in measuring risk include standard deviation, beta, and different ratios involving the sharpe index ratio.
Standard Deviation
The standard deviation depicts the variation in the values of the returns generated by the funds in relation to the average returns. For example, if the average return value of a fund is 10%, and the standard deviation of the same fund is 20%, then the chances of variation in the returns value of the fund will be either 20% higher or 20% lower. This means wither the fund will have 12% returns or 8% returns as per the market moves.
Beta
The beta value of a fund demonstrate the change in the price of a fund in relation to the change in the market indices. It is a measure used to calculate the systematic risk of a fund. If the beta of the fund is less than 1, it shows that the fund is less volatile than the market, and if the beta is more than 1, it shows that the fund is more volatile than the market. For example, if a fund’s beta is 1.2, then it is 20% more volatile than the market, and if the beta is 0.80, then the fund is 20% less volatile than the market.
Analysis of Risk in ELSS Funds

Our research team has analysed the risk involved in various ELSS funds by measuring the standard deviation and beta factors of various schemes.
- The data analysis, as shown above, depicts the standard deviation of the funds in three different investment tenure which are long-term periods of three, five and ten years.
- The table shows the individual risk levels of the funds, where the standard deviation of the funds in different periods depicts the variation in the values of the funds concerning market changes and helpful to calculate whether the risk is high or low.
- The funds with higher standard deviation than the category are strong performers involving higher risk though high rewarding potential.
- The beta of some funds is more than 1 showing higher risk involved in relation to market volatility.
- The funds with more than one beta are high performing funds at times when the market performance is positive.
Overall Risk Review of ELSS Funds
Risk and returns are proportionate to each other, higher the risk; higher the returns. In the case of ELSS, as per the various returns analysis reports of the funds, the risk is termed to be moderately high, and so are the returns. The long-term investments in ELSS are actually beneficial for the sake of earning greater profits irrespective of the market fluctuations.
 Retirement Planning Fund
 Best Tax Saving Funds
 Child Future Planning Funds
 Smart Saving Account
 Top Performing Funds
 New Fund Offer (NFO)

.webp)
 2168
2168  7 Min. Read
_(1).webp)
.webp)
_(1).webp)