How to Measure the Risks Associated with Mutual Funds?

‘There is no investment with zero percent of risk.’ Yes, it is ‘The Fact’. Then, what are those flashy figures of dividend payouts, yearly returns, and rankings of the mutual funds that the fund websites and advertisements boast of? These tempting numbers are the candy flosses to attract the investors’ eyeballs towards their schemes.
But committing yourself to any mutual fund based on its historical returns and dividends is simply ignoring the risks involved. Investors aspire to have the best mutual fund in their portfolios but the key to pick the winner is to know the risk associated with it. And most importantly, they need to evaluate the risk that goes along with the mutual fund, at a regular interval. But, how can we accomplish that?
There are five predominant indicators that analyze the risks associated with the stocks/bonds/mutual fund portfolios. Modern Portfolio Theory (MPT) is a financial methodology that acknowledges Alpha, Beta, Standard Deviation, R-Squared, and Sharpe Ratio as the five historical predictors of investment risks.
The power of these five indicators will assist the investors to evaluate the risk-reward parameters of any particular mutual fund scheme, by contrasting it with the market benchmark. All you need is to perform a small 5-step test as outlined below-
For the purpose, we are considering a hypothetical example of “PQR-Equity (G)” scheme to measure its riskiness in our “Power of 5” concept:-
- Standard Deviation
The most popular way of measuring the mutual fund risk is Standard Deviation. It evaluates the volatility of the return of mutual fund scheme. In this approach, the degree of deviation of actual return on a fund from its expected return is computed, based on the historical performance. For example, if a fund shows an average return of 10% and a standard deviation of 5%, then its actual return can disperse in the range of 5% to 15%.
Higher the Standard Deviation, higher is the NAV volatility of the mutual fund, and ultimately higher is the risk. Standard deviation must be used to compare the risk levels of a mutual fund with other mutual funds having same investment objectives. (Multi-cap to multi-cap, large-cap to large-cap)
For instance,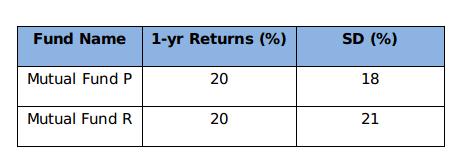
As we can see, both the funds in the example are conveying 20% return in one year. But a Standard Deviation of 18% makes Fund P less volatile or risky as compared to Fund B having Standard Deviation of 21%. - Sharpe Ratio
Sharpe Ratio is one of the popular methods of tracking the performance of the mutual fund. Developed by Nobel laureate economist William Sharpe, this ratio is a risk-adjusted measure of return that compares the performance of one fund to that of another. The Sharpe ratio signifies that whether the returns from an investment are due to smart investment decisions or the by-product of excess risk.
Mathematically, Sharpe Ratio derives the return that a fund has generated against the risk taken by it with the following formula:
Share Ratio = (Rp-Rf)/SD(p)
Where,
- P = Mutual Fund
- Rp = Return of the fund
- Rf =Risk Free Return
- SD(p) = Standard Deviation of Fund
Here, Risk is measured by Standard Deviation.
A higher Sharpe ratio indicates a more considerable mutual fund. As for the same risk level, a higher Sharpe ratio means higher excessive returns per unit of risk. For instance, a fund A generates an average return of 15% with a standard deviation of 8%. Another fund B was able to post return of 12% with standard deviation of 5%. Let us assume that the risk free rate of return is 5%. This shows that fund A is exposed to higher risk than fund B.
But the Sharpe Ratio of fund A would be 1.25 while that of fund B would be 1.4. Despite a lower average return, fund B is better to invest in.
As is the case with Standard Deviation, Sharpe Ratio should be used to compare a fund with its peer group mutual funds only, for accurate evaluation. - Alpha (α)
This alpha plays a crucial role in the science of investment. It is fundamentally the deviation of the return expected by an investor from a fund, from its actual returns when the beta is given. It is a measure to compare the volatility of a fund portfolio with respect to the risk-adjusted performance of its benchmark index. The excess return of the fund relative to its benchmark index is the ‘alpha’ of that mutual fund. The computation of alpha of a fund is based on the one year return of fund and its benchmark.
Computation:
α = Rp – [Rf + (Rm – Rf) β]
Where,
- α = Alpha
- Rp = Realized return of fund
- Rm = Market return (Benchmark return)
- Rf = risk-free rate
- β = Beta
For example, a fund shows a positive alpha of 13%, this simply suggests the fund has outperformed its benchmark by 13% during a given time period. Similarly, if it shows a negative alpha of 11%, the fund has underperformed by 10%.
A higher positive value of alpha symbolizes a better mutual fund scheme. - Beta (β)
As we calculated the Alpha of a fund, we came across a term Beta (β). What actually Beta (β) denotes?
Beta highlights the tendency of a mutual fund scheme to respond towards the market movements. Technically, ‘beta coefficient’ evaluates the volatility or systematic risk of the fund portfolio in comparison to the market. Beta is always benchmarked to 1 which means that the market has the beta of 1.
A fund is considered to be less volatile as compared to the market movement if its Beta is 0.80. Whereas, if it is greater than 1, say 1.20, then the fund is identified as highly volatile as compared to the market movement. For better understanding, the NAV of the fund with Beta 0.80 would move down by 4% if the market goes up by 5%, and the fund with beta 1.20 would go up by 6%.
There must be a minimum correlation of 0.70 between the mutual fund and the market movement. Higher correlation of a mutual fund with the benchmark ensures beta does not lose its significance.
So which situation is good for us - high beta or low beta? Well, that totally depends upon the condition of the market. The bullish sentiments of the market favor high beta mutual funds, and the low beta funds would work as the lifesaver in the bearish market. - R-Squared
All the risk measurement tools seem to be interrelated, as they are derived in conjunction with each other. As we have discussed above, there should be a significant correlation between the beta of the fund and benchmark index. This significance of the Beta is calculated using the R-Squared method.
R-Squared values range from 0 to 1, where 1 represents full correlation and 0 represents no correlation between the mutual fund and the benchmark index. For instance, the R-squared of an index fund will be one if it invests in same securities and in the same proportion as the index.
If the R-Squared value of a fund ranges from 0.85 to 1, it indicates a close correlation between mutual fund and the benchmark index. A fund rated with 0.70 or less value indicates the futility of beta and would not perform like the benchmark index. R-squared and Beta are calculated based on the historical data, so they provide an appropriate estimate of the risk before investing. Lower R-Squared value signifies less reliability of Beta, and vice-versa.
Quick View
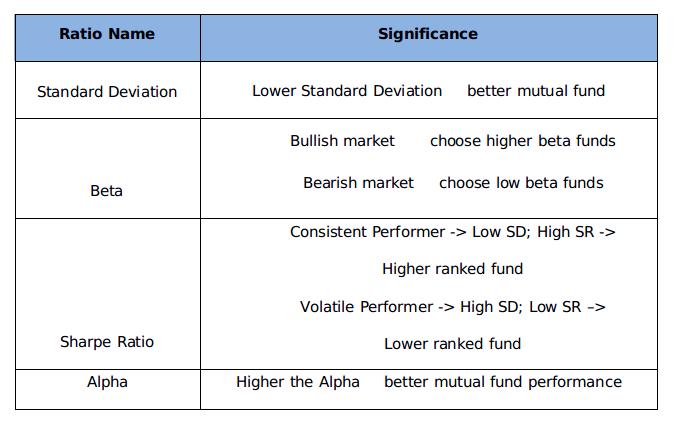
The Bottom Line
This ‘power of 5’ concept is framed to assist the investors in taking a wise decision on their mutual fund investments. We know that the investment in any type of financial instrument is accompanied by risk in one or the other way. But we suggest avoiding the hasty decisions while investing your money. Investing blindly on the basis of past returns is as similar as expecting good rice yield and overlooking the climatic or other risks and not taking the precautions for the same.
The five risk measures that are being focused on provide some balance to the risk-return equation. The good news is that these indicators are readily calculated and are available on financial websites, as well as being incorporated into research reports. For example, as you visit MySIPonline and choose a mutual fund you wish to evaluate, you will find the current data for all the above parameters (under the Risk Measures tab of a particular fund).